In this article, we will look at how to create dashboard in Azure DevOps. This will be helpful if you want to automate the process of reporting and avoid using Excel & PowerPoint. Let’s take a look at the steps below
Step 1 :
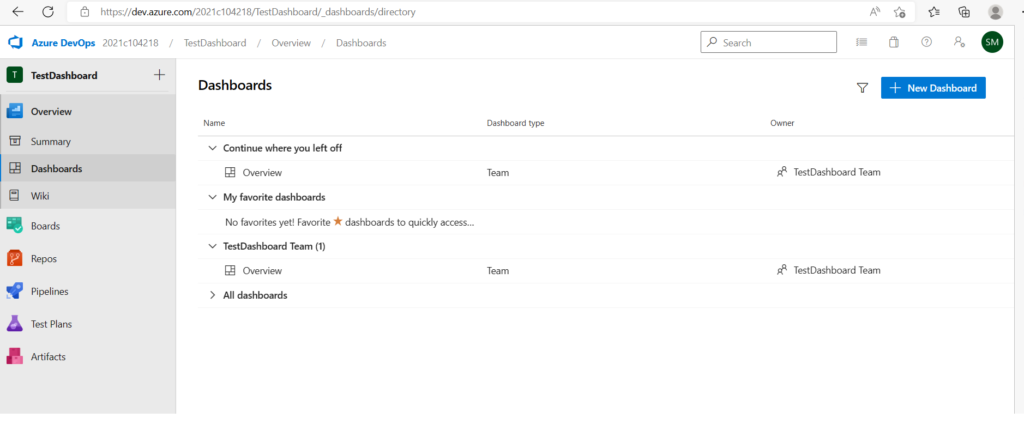
Choose ‘Dashboard’ option in the left-hand menu and click on ‘New Dashboard’
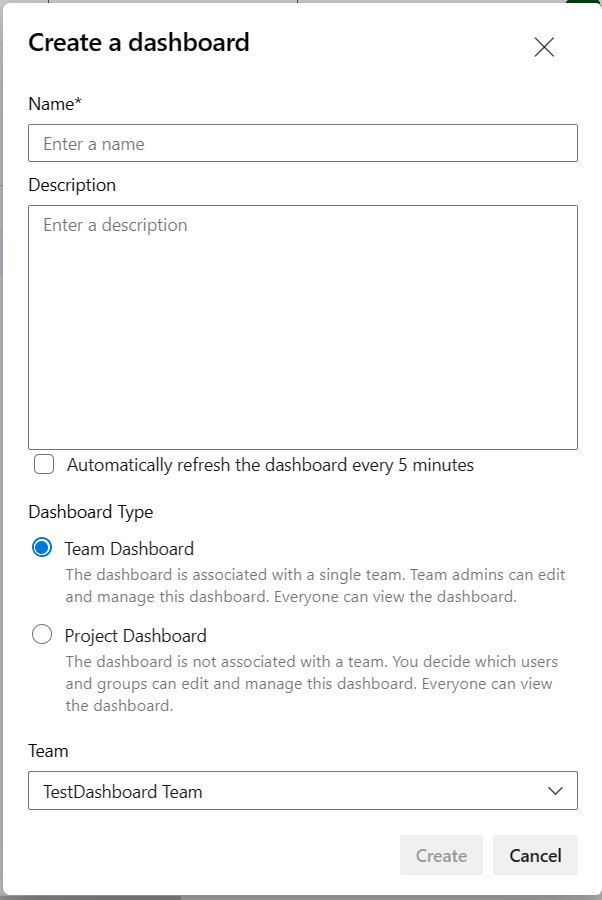
Name – Title of the dashboard to be given in the field
Description – Details of the dashboard to be given in this field
Automatically refresh the dashboard every 5 minutes – Choose this to refresh the dashboard data automatically with the latest one every 5 minutes
Dashboard Type – It can be created for specific team or project
Step 2:
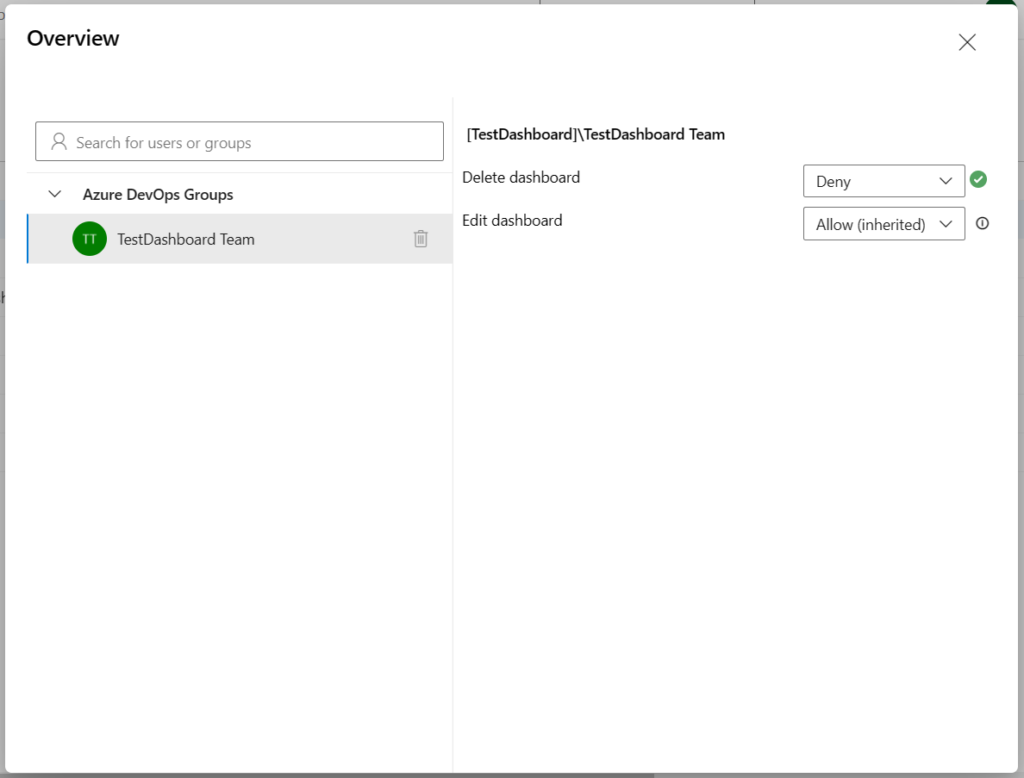
Setting up permission for the dashboard created. ‘Overview’ is the dashboard name I had given and editing/deleting permission can be allowed or denied for specific users/groups with the option ‘Allow’ , ‘Deny’.
Click on the ‘…’ dots in the dashboard summary page.
Step 3:
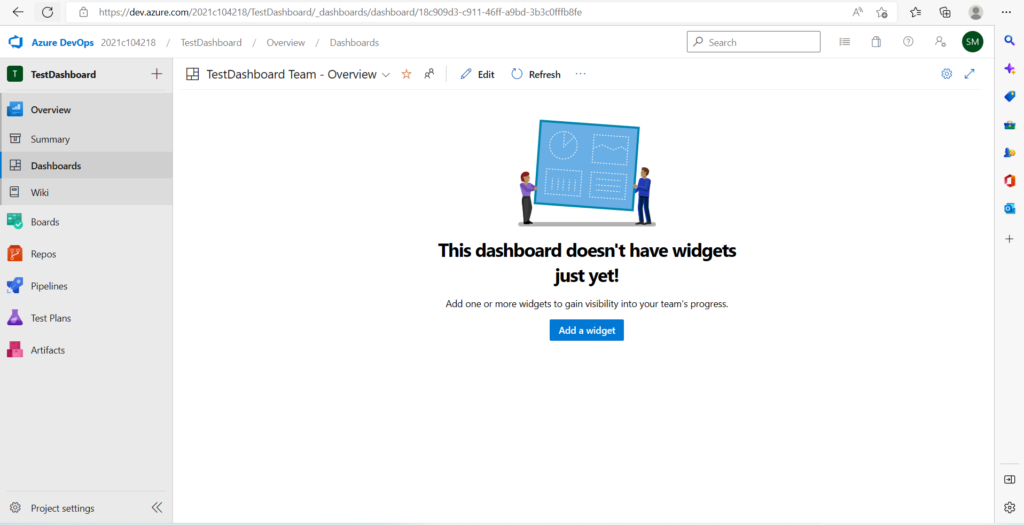
Click on the ‘title’ of the dashboard to get into the page
Step 4:
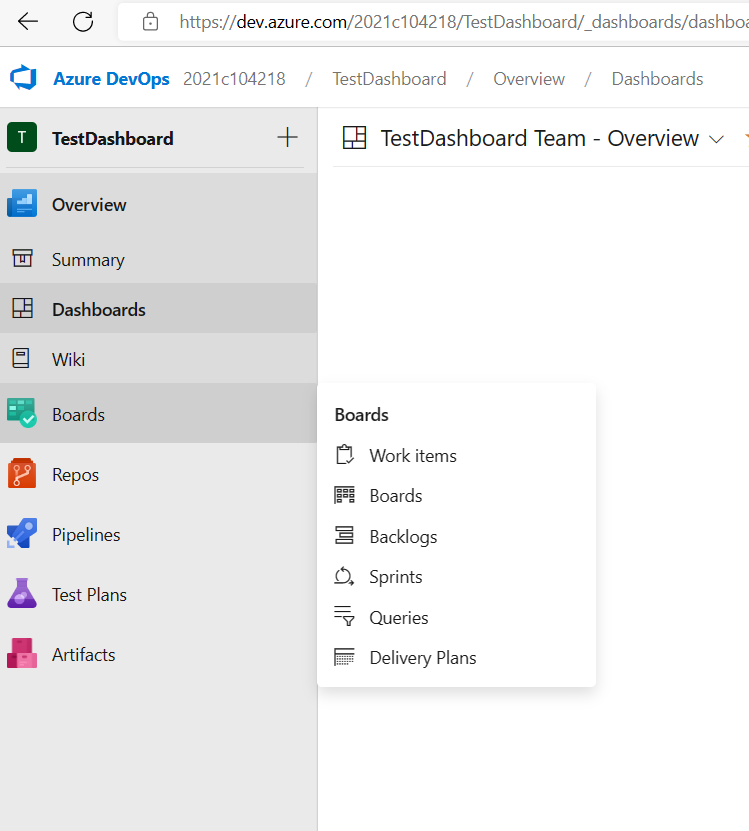
Before adding widgets to the dashboard, lets create shared query to build the dashboard. Choose ‘Queries’ option under ‘Boards’ menu
Step 5:
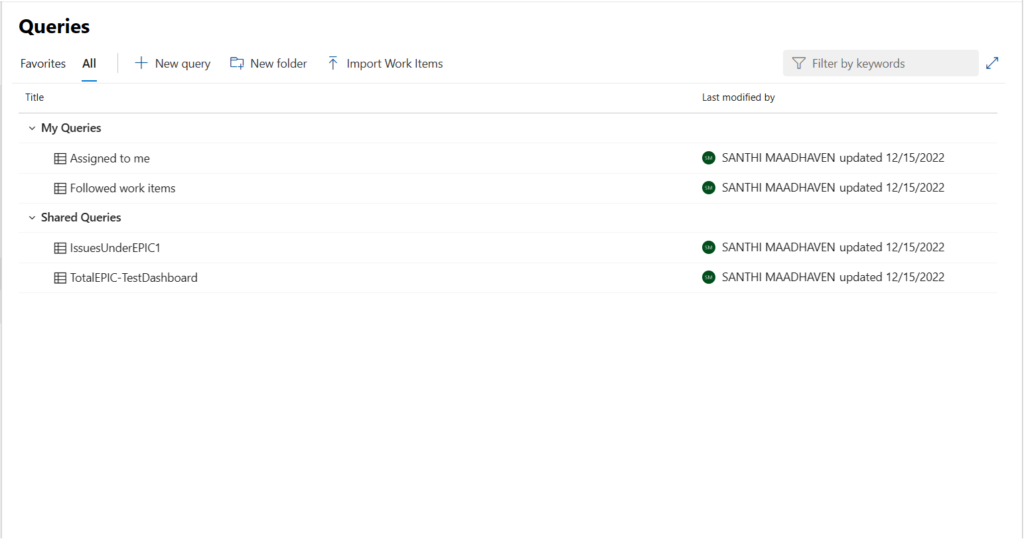
Click on ‘New Query’ to create query. There are two sections : ‘My Queries’ – Visible only to yourself and ‘Shared Queries’ – Visible to everyone
Step 6 :
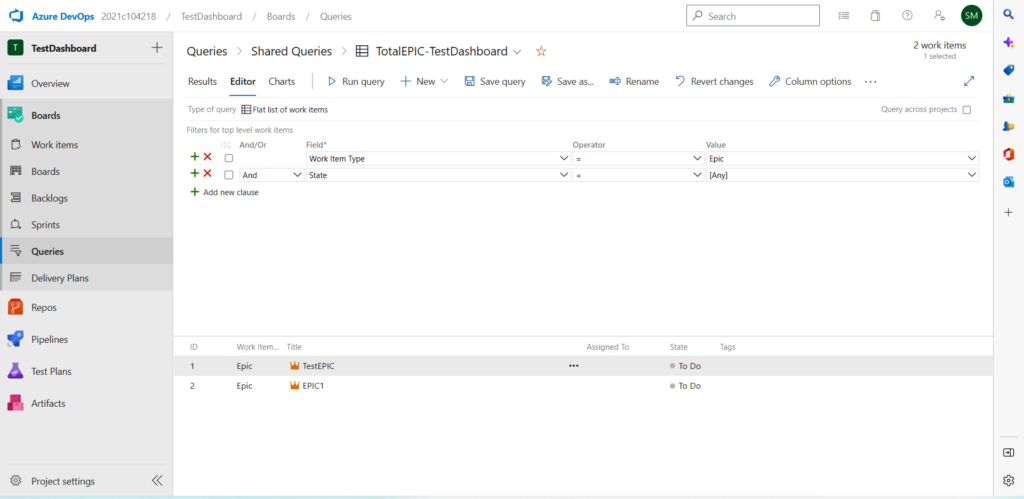
Query can be written using the UI editor. I had created ‘Shared Queries’ because it have to be incorporated in the dashboard widget.
Step 7 :
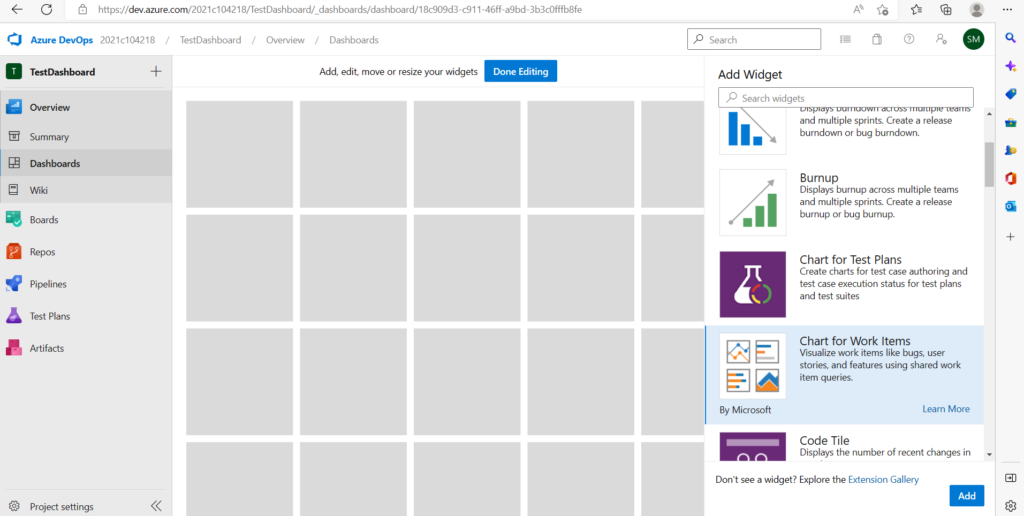
Choose ‘Dashboard’ page again and click on ‘Add a Widget’ option
Choose ‘Chart for work items’ under ‘Widget’ and click on ‘Add’ to include in dashboard.
Choose ‘Configure widget’
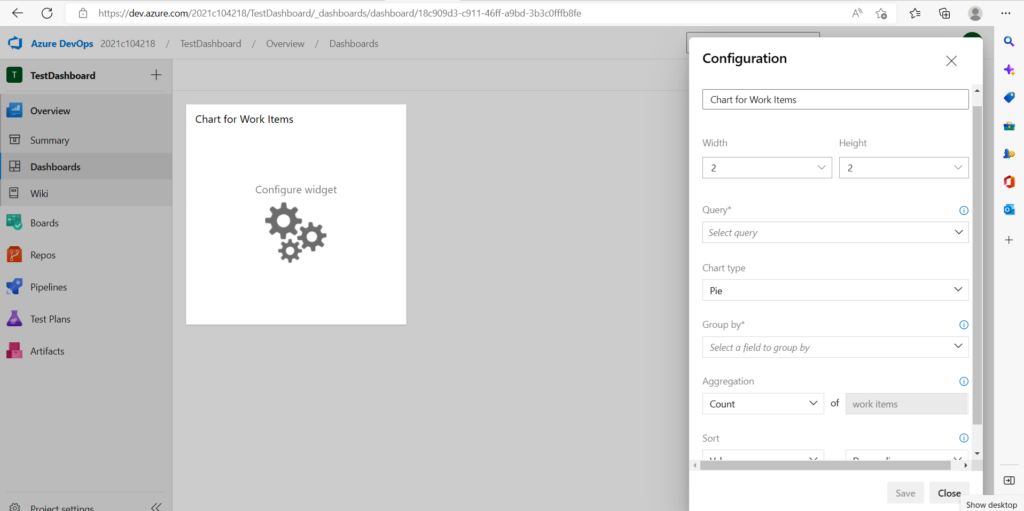
Under configuration of the widget,
Title – Title of the chart to be given
Width & Height – Choose the size of the widget
Query – Choose shared query
Chart Type – Choose ‘Pie’ chart
Group by – Choose any field returned from the query
Aggregation – It can be ‘count’ of work items
Sort – It can be ‘ascending’ or ‘descending’ based on the data
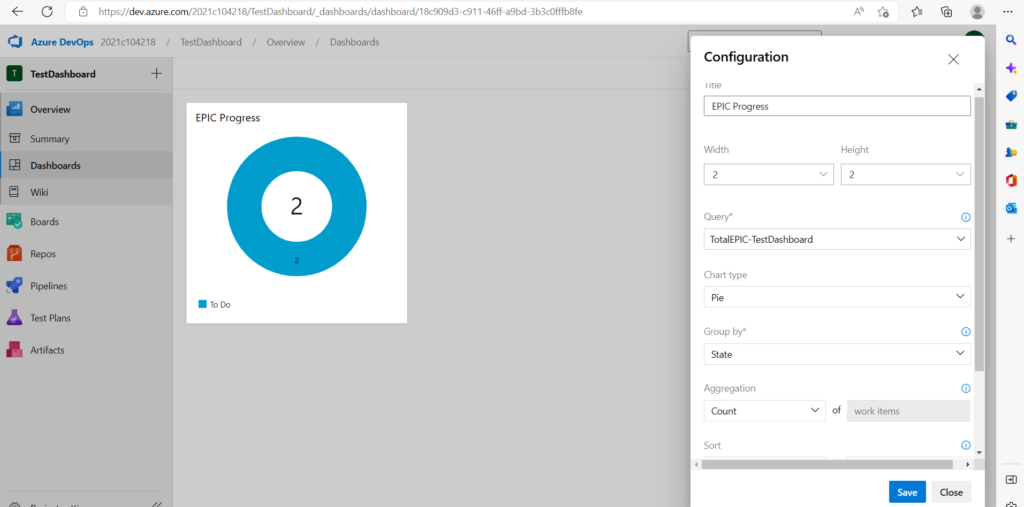
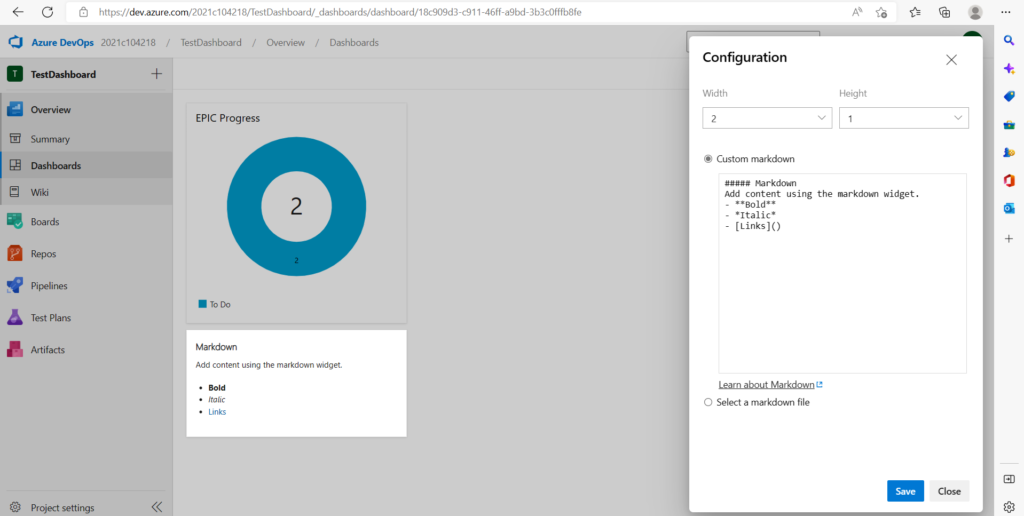
Chart is complete and now the text for the progress can be included by using ‘Markdown’ widget
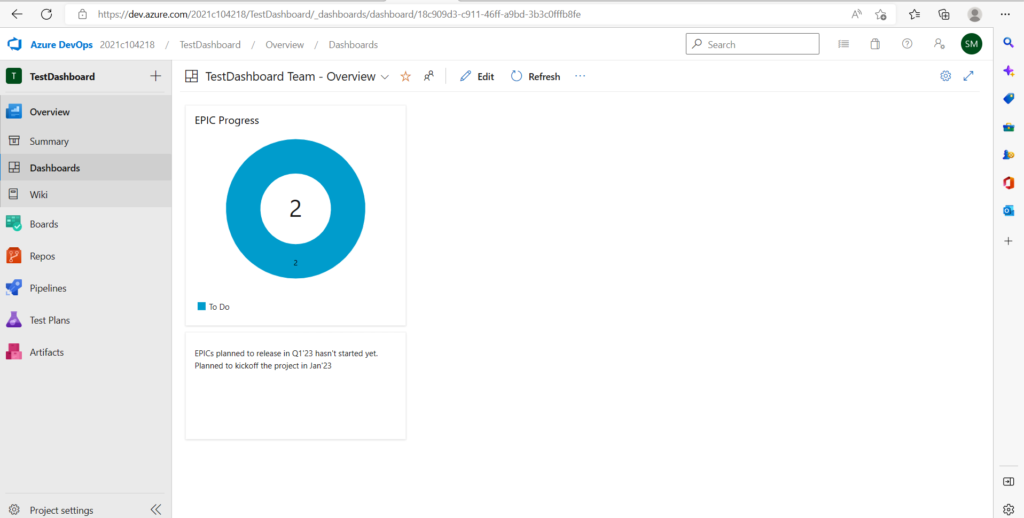
Dashboard creation is done and this can be shared during meeting to showcase on the progress. Hope this article is helpful for you.