During progress of the project, many a times we may have to look at the backlog for analysis and do some decision making to ensure we meet the timeline.
For example,
- We may be interested to look at the defects bifurcation once all development is over to see which area have more defects & decide which one to pick up first for fixing as well as look at what can be improved in future to avoid it.
- We may be interested to look at backlog stories that needs to be completed when we are lacking progress to look at which features have more stories in ‘To Do’. It will enable management to make decision whether to do split the releases.
In this article, we will look at how we can visually bring this in dashboard & how we can bifurcate issues (defects/stories). Example I have created is for stories and we will bifurcate based on releases & features.
Let’s look at steps below
Step 1:
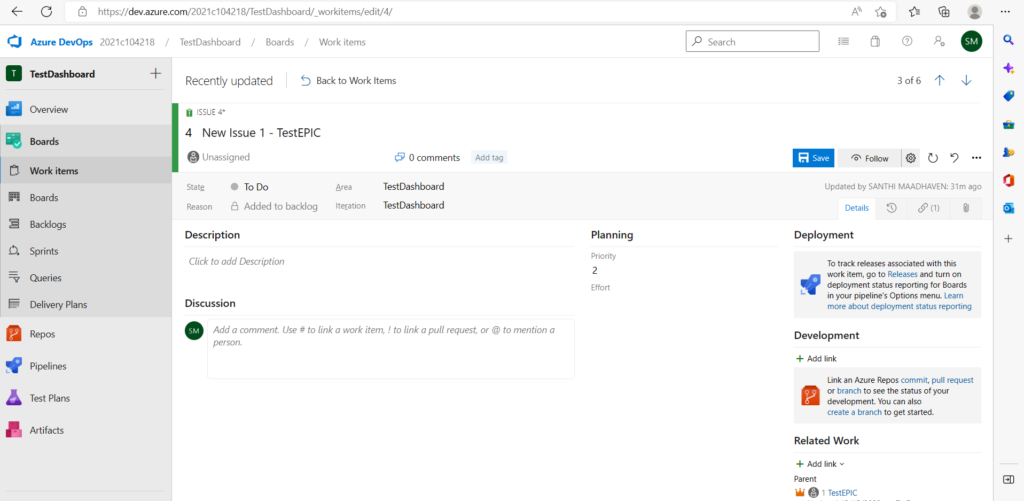
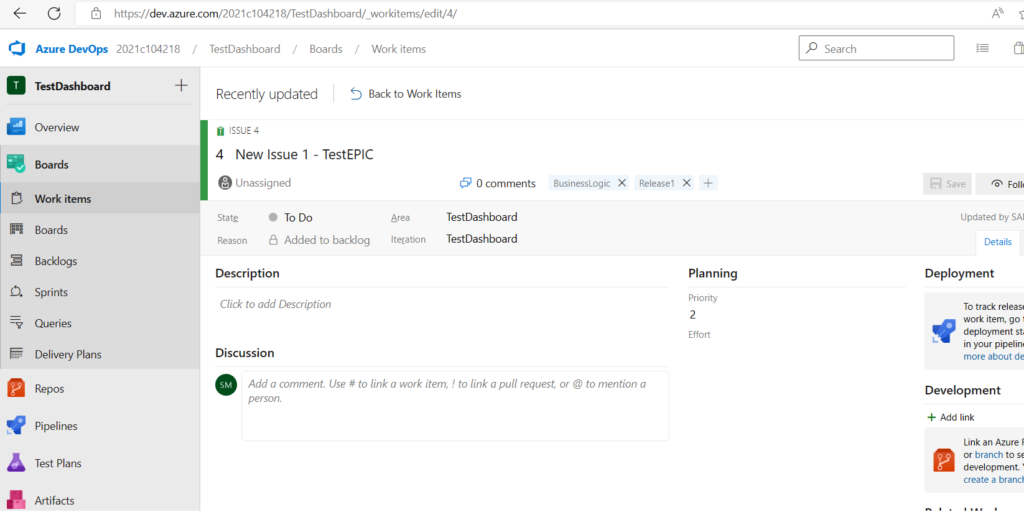
For creating bifurcation, we need to create tags first. Click on ‘Add tag’ and type free flow text for adding tags. I had created ‘Release1’,’BusinessLogic’ for one of the issues which is shown in screenshot below
Step 2:
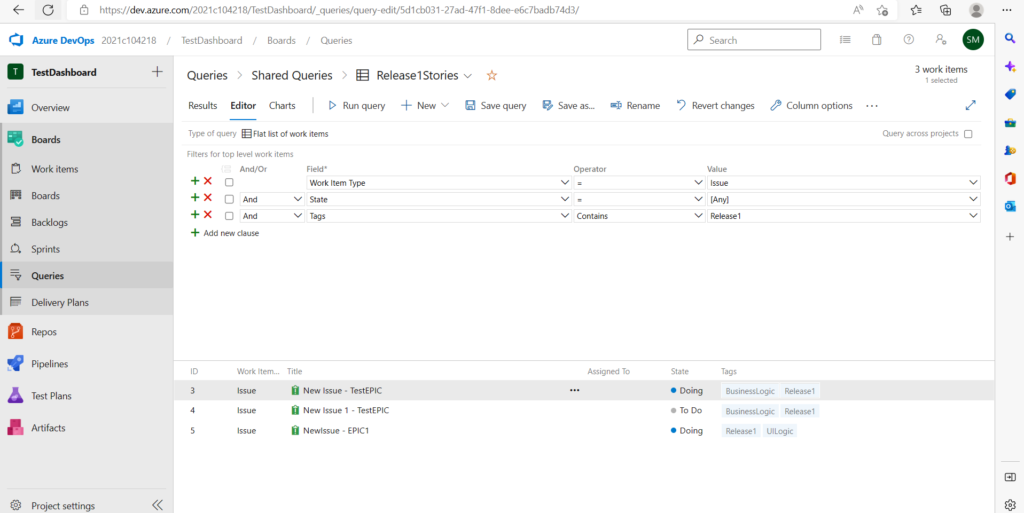
Create shared query with filter of tags for releases. Am naming it as ‘Release1Stories’
Step 3:
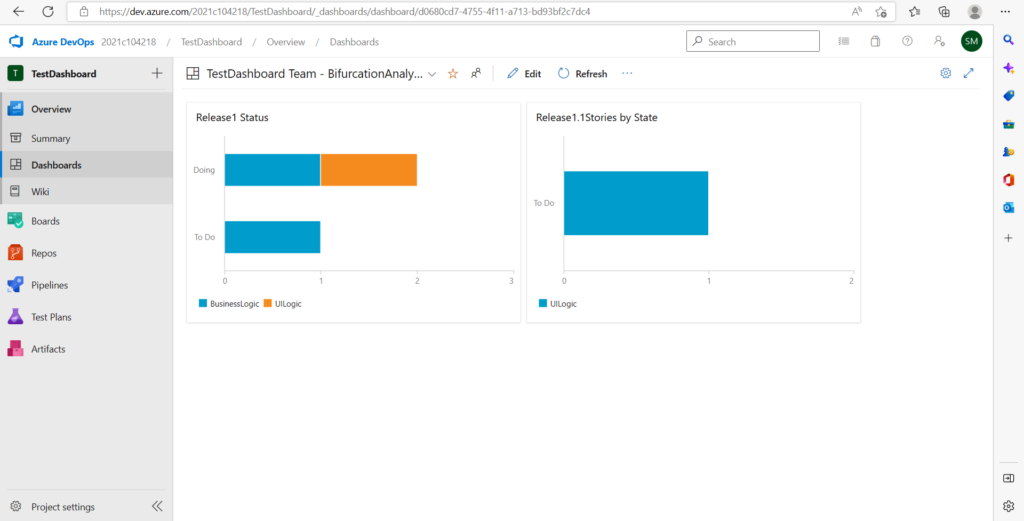
Create dashboard and ‘Add widget’. Choose ‘Chart for work item’ and choose the shared query which we created. I had chosen stacked bar chart and chosen tags ‘BusinessLogic’ and ‘UILogic’.
In the screenshot below, it shows the release wise stories bifurcation and shows the split of which is in ‘In Progress’ and ‘To Do’. This will enable to make decisions for