In this article, we will look at the stages of big data analytics lifecycle in detail.
Below diagram depicts the 9 stages of big data analytics.
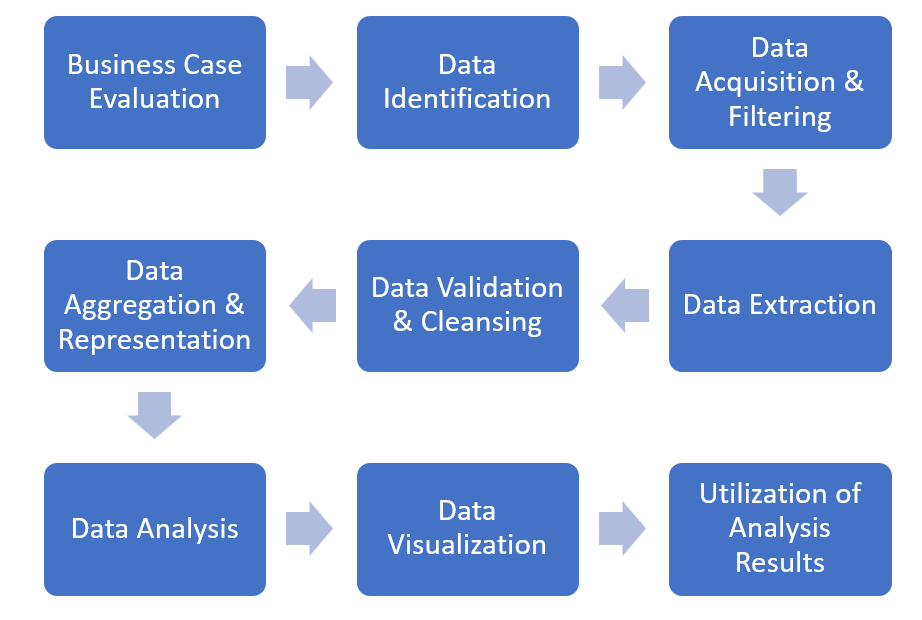
Stage 1: Business Case Evaluation
In this stage, based on business requirements need to evaluate whether the business problems being addressed is really big data problem.
Business case should be well written with the justification, motivation and goals of carrying out the analysis.
Outcome:
- Business case should be created, assessed and approved
- Business challenges that analysis will tackle
- KPIs are identified to determine assessment criteria and guidance for evaluation of the analytic results
Stage 2: Data Identification
In this stage, identify the dataset required for analysis and sources. The required datasets & sources can be internal or external.
Internal datasets – From internal sources, such as data marts and operational systems compile and verify for data required. External datasets – From third-party sources, such as data markets and publicly available datasets compile and verify for data required.
Outcome:
- Identify the dataset required for analysis
Stage 3: Data Acquisition and Filtering
In this stage, data is gathered from all the data sources that were identified during the last stage. Acquired data is then looked upon for
- Filtering/removal of corrupt data
- Removal of unusable data for analysis
Data needs to be persisted once it gets generated.
Outcome:
- Filtered data sets by removing noise
- Data is persisted
Stage 4: Data Extraction
In this stage, data is extracted and transformed it into a format that the underlying big data solution can use for the purpose of the data analysis.
Outcome:
- Transformation of data for the purpose of data analysis
Stage 5: Data Validation & Cleansing
In this stage, data validated for invalid /missing data & cleansing will be done. Invalid data can skew and falsify analysis results.
Outcome:
- Cleanse the dataset
Stage 6: Data Aggregation & Representation
In this stage, multiple datasets are integrated to arrive at a unified view. Data reconciliation from multiple sources needs to be done.
Need to do future data analysis requirement to foster data reusability.
Outcome:
- Data Aggregation & future data analysis requirement complete
Stage 7: Data Analysis
In this stage, actual analysis task will be carried out which will be iterative process till the appropriate pattern or correlation is uncovered.
Outcome:
- Identify pattern or correlation
Stage 8: Data Visualization
In this stage, analysed data will be represented using graphical tools for interpretation by business users. Its important to use the most suitable visualisation technique by keeping the business domain in context
Outcome:
- Visual charts
Stage 9: Utilization of Analysis Results
In this stage, it will be determined how and where processed analysis data can be further leveraged. Analysis can possibly provide new insights & patterns which can be used to improve business process and application system logic.
It can be used as input for enterprise systems & alerts, optimisation of business process.
Outcome:
- Identify & leverage analysis results further
Hope this article will be helpful for you.